Automated SEO Reporting: What to Track and What It Costs
SearchBlueprint · · 11 min read · scored 94/100

Automated SEO reporting is software that pulls your ranking, traffic, and technical data into one recurring report on a set schedule, so you see what changed without pulling spreadsheets by hand every week. It connects to Google Search Console, Google Analytics, and a rank tracker, then refreshes on its own. You open a finished report instead of building one.
What Is Automated SEO Reporting?
Automated SEO reporting is the process of generating SEO performance reports on a fixed schedule, without manually exporting and formatting data each time. The software connects to your data sources once, then refreshes the numbers automatically.
Instead of logging into Google Search Console, copying numbers into a spreadsheet, and building charts by hand, you set the report up once. After that, it runs weekly, monthly, or on whatever cadence you choose, and lands in an inbox or dashboard ready to read.
The appeal is time. A manual report can take an afternoon to assemble across multiple tools. An automated one takes minutes to configure and then costs nothing per cycle after that.
Why Automate Your SEO Reporting

The Manual Reporting Problem
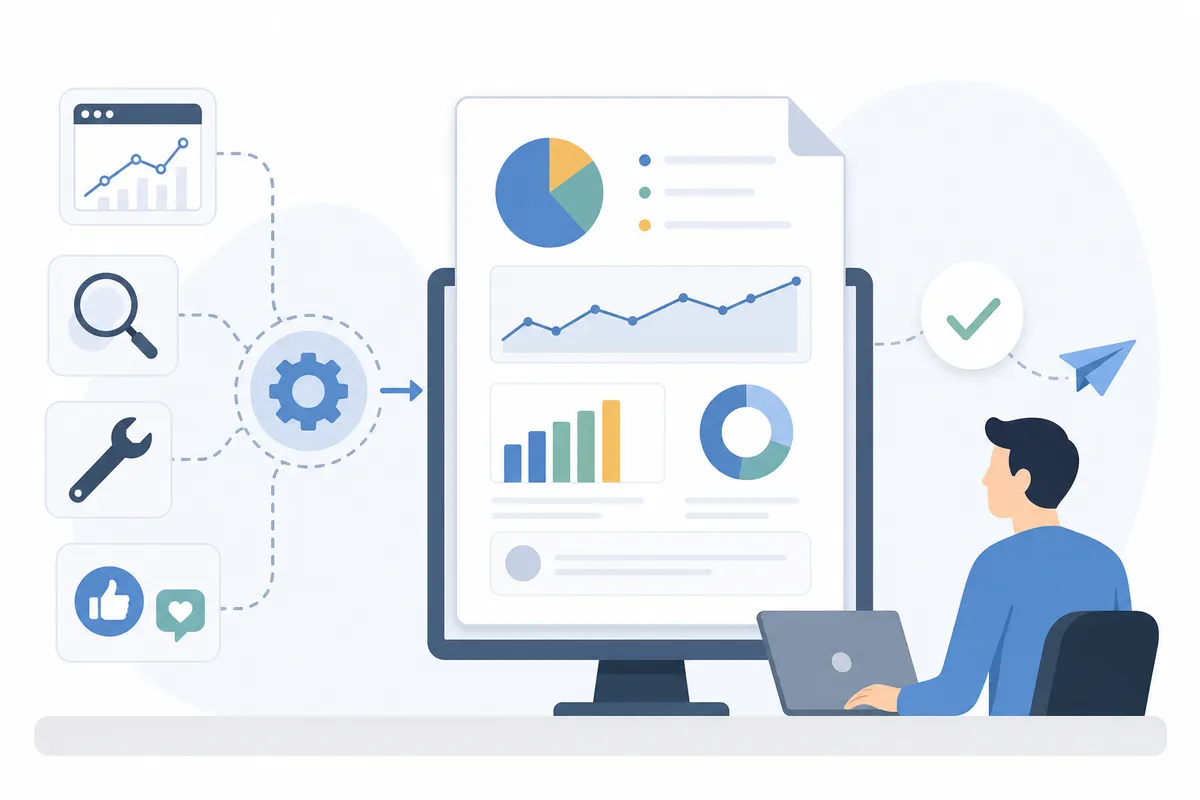
Manual SEO reporting means copying numbers from Google Analytics, checking date ranges twice, and rebuilding charts every single cycle. It is slow, and it is easy to get wrong. A single mistyped date range can throw off a whole month of comparisons.
Worse, by the time a manual report is finished, the person reading it often skims it and moves on. The insight that mattered gets buried in formatting work instead of surfaced clearly.
What You Gain Once Reports Run Themselves
Once reporting is automated, the benefits show up fast. You get consistent formatting every cycle, so comparisons across months are actually apples-to-apples. Reports become shareable across a team without anyone re-building them. And if you work with an agency, an automated report becomes a shared home base both sides can point to when setting expectations.
There is a bigger reason this matters now. Research cited by HubSpot found that sites publishing 16 or more blog posts a month get roughly 3.5 times the traffic of sites publishing zero to four. That kind of publishing pace produces a lot of moving numbers, and manual reporting struggles to keep up with it. Automated SEO reporting is built for exactly that volume.
For a longer breakdown of what to automate first and what still needs a human, see our guide to SEO automation, and for the wider case for automating SEO work overall, this piece on the advantages automated SEO delivers for growing businesses covers it in more depth.
The Core Metrics Every Automated SEO Report Should Track
Not every metric belongs in every report. But a handful of them show up in nearly every serious SEO reporting setup, because they answer the questions stakeholders actually ask.
Search Engine Rankings
Rankings show where your priority keywords sit on the results page. The goal is usually page one, ideally near the top, since position strongly affects click-through rate. Track rankings for every keyword you are actively targeting, not just your top few.
Rank data changes daily in some niches, so a weekly cadence catches movement before it becomes a surprise. A tool that runs weekly rank tracking broken out per market removes the guesswork of when to check.
Organic Traffic and Search Visibility
Organic traffic is any visit that arrives through unpaid search results, from Google, Bing, or elsewhere. Growth here usually means more conversions and more revenue, so it belongs in nearly every report.
Search visibility data from Google Search Console adds context traffic numbers alone cannot give you: impressions, clicks, and average position per query. High impressions with low clicks often means a page ranks but its title or description is not compelling enough to earn the click.
This context matters more than it used to. An estimated 58.5% of US Google searches now end without a click, and 96.6% of all pages get zero organic traffic from Google at all. A report that shows impressions alongside clicks is the only way to tell whether a page is actually invisible or just not being clicked.
Technical SEO Issues
Search engine crawlers do not browse your site the way a visitor does. They move from link to link through your HTML, and a broken link or page error can stop them from reaching content entirely. Technical reporting should flag crawl errors, broken links, and indexing problems as they appear, not months later.
Backlink Profile
Backlinks strengthen your site's authority, so tracking new links, lost links, and referring domains belongs in most reports. This also catches problems early. A sudden, unnatural spike in backlinks can mean spam is targeting your site, and you want to know that fast, not at the end of the quarter.
AI Visibility
This is the newest addition to the list, and it is growing fast. Roughly 45% of consumers now use AI tools like ChatGPT or Gemini for business recommendations, according to BrightLocal's 2026 research. A report that only tracks Google rankings misses a channel that is already influencing purchase decisions. Tracking how often your brand gets cited or recommended by AI tools is becoming a standard line item, not an extra.
The table below summarizes how these pieces typically fit together.
| Metric | What It Shows | Primary Data Source | Typical Reporting Cadence |
|---|---|---|---|
| Search rankings | Where target keywords sit on the results page | Rank tracker | Weekly |
| Organic traffic | Visits arriving from unpaid search results | Google Analytics | Weekly or monthly |
| Search visibility | Impressions, clicks, and average position per query | Google Search Console | Weekly |
| Technical health | Crawl errors, broken links, indexing problems | Site audit tool | Monthly |
| Backlink profile | New, lost, and referring domains | Backlink checker | Monthly |
| AI visibility | How often AI tools cite or recommend the brand | AI visibility tracker | Monthly |
Google's own documentation on how Search Console reports impressions, clicks, and position is worth reading directly if you want the mechanics behind that data, available through Google Search Central.

How to Set Up Automated SEO Reporting
Setting this up is less about picking software and more about deciding what the report needs to answer before you connect anything.
Connect Your Data Sources
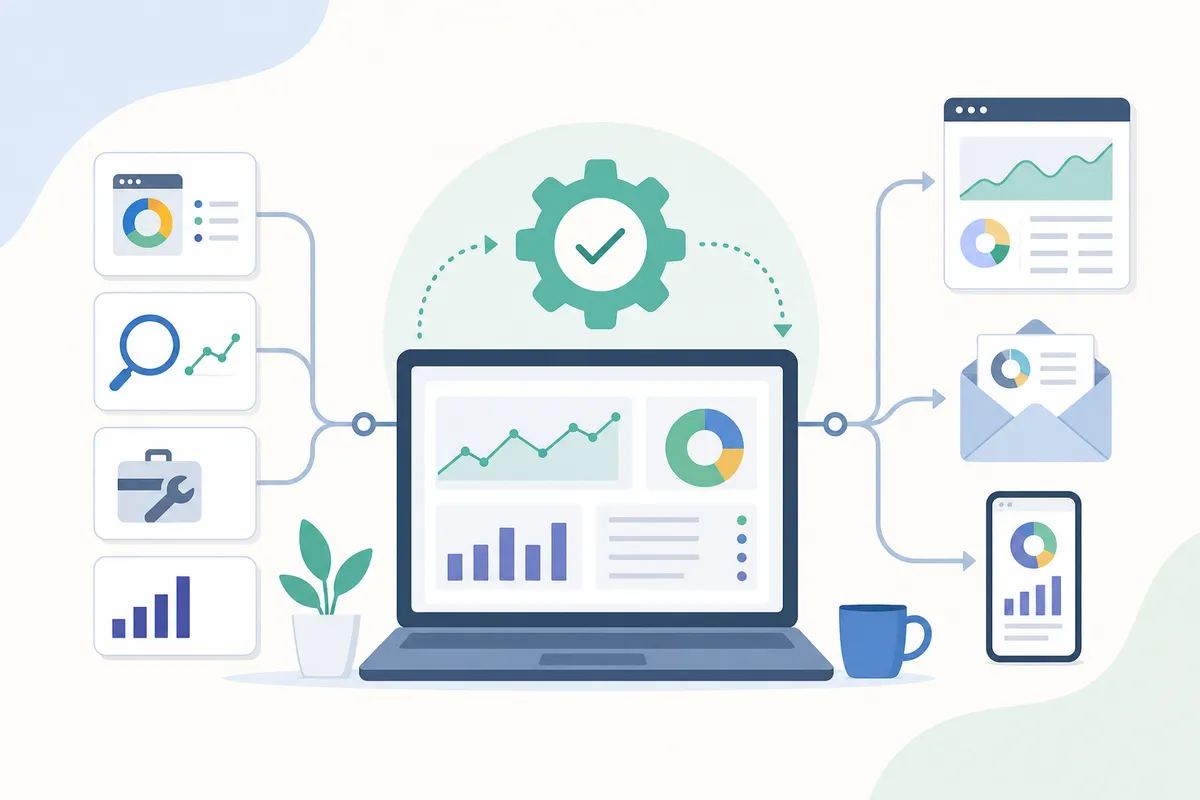
Start by linking Google Search Console and Google Analytics, since they cover rankings, visibility, and on-site traffic behavior between them. From there, add whatever specialized tools cover backlinks, technical audits, or AI visibility. Most reporting platforms can pull from several sources into a single dashboard, so you are not juggling five logins.
Pick a Schedule and a Template
Decide who the report is for before you decide what it shows. A report for an internal team usually tracks organic traffic and technical health closely. A report built for a client leans on progress and rankings, since that is what justifies the engagement.
Keep the same layout every cycle. A fixed template with the same sections in the same order makes month-over-month comparisons far easier to read at a glance.
Decide Who Sees the Report
Automated does not mean unsupervised. Someone should still review the numbers before they go out, at least until you trust the pipeline. And someone needs to actually read the finished report. A stakeholder who searched online 93% of the time before choosing a provider is going to ask direct questions about what changed. A report with no one assigned to explain it does not answer them.
How to Choose an Automated SEO Reporting Tool
The market for SEO reporting software is crowded, and most tools look similar at a glance. A few factors actually separate them in daily use.
Customization and White-Labeling
Different teams inside the same company usually care about different metrics. Choose a tool that lets you segment by subdomain, page group, or campaign, and pick exactly which metrics appear. If you report to outside clients, white-labeling matters even more. Agencies reporting to multiple clients need reports that carry their own branding instead of a vendor's logo on every page.
Integrations and Data Sources
A reporting tool is only as good as what it connects to. Make sure it pulls real-time or near-real-time data from Google Search Console and Google Analytics at minimum, and check whether it covers backlinks, technical audits, and AI visibility natively or requires a separate tool for each.
Frequency and Templates
Some metrics need weekly attention, like rankings during a competitive push. Others, like backlink trends, are fine monthly. A good tool lets you set different cadences for different sections rather than forcing one schedule on everything.
Pricing varies widely depending on how much of this you need bundled together. The comparison below reflects typical published pricing for automation and white-labeling across common reporting tools.
| Tool | Report Formats | White-Label Reports | Typical Cost for Automation |
|---|---|---|---|
| Google Looker Studio | PDF, HTML | Not available | Free |
| Google Analytics | HTML | Not available | Free |
| SEO PowerSuite | PDF, HTML | Yes, on the Enterprise plan | Enterprise at $599 a year, Max+ at $899 a year |
| Databox | PDF, Slides | Yes, as an add-on or on Agency Premium | Add-on around $200 a month, or bundled at $999 a month on Agency Premium |
| SE Ranking | PDF, XLS, HTML | Yes, on the Agency Pack | Included with agency-tier plans |
Free tools handle the basics well but stop short of white-labeling and multi-source blending. Paid platforms earn their cost mainly through automation depth and agency features, not through data you could not get elsewhere for free.
If you want to see what a fully assembled report actually looks like rather than compare feature lists, a platform built around reporting, rank tracking, and content as one connected workflow is worth reviewing directly.
Common Mistakes That Make Automated Reports Useless
Automated reporting can go wrong in the same handful of ways, over and over.
- Including too many metrics. A report that shows everything the tool can measure makes it hard to find what actually matters. Stick to rankings, traffic, backlinks, and technical data tied to active work.
- Reporting totals with no comparison. A single traffic number tells you nothing. Every metric needs a comparison to the prior period, or there is no way to tell if performance improved or declined.
- Mixing tools with no labels. Different platforms calculate similar-sounding metrics differently. Label which tool produced each section, or comparisons across time will not line up.
- Keeping stale metrics. Priorities shift. A metric that mattered during a technical cleanup six months ago may be dead weight now. Review the report structure periodically and drop what no longer earns its place.
- Sending a report no one explains. One documented case saw a site's indexed pages grow from 12 to 548 over 12 months, with organic clicks climbing past 600 a month. That kind of trend is easy to miss inside a report if nobody flags what it means.
Should You Build Your Own Reports or Use a Tool?
This is a genuine either-or question, and the honest answer depends on scale.
Building your own dashboard in a free tool like Google Looker Studio works fine if you manage one site with a handful of metrics. It costs nothing beyond setup time, and it keeps you close to the raw data.
It stops working once you manage several sites, need white-labeling, or want backlinks and AI visibility pulled into the same view as traffic. At that point, stitching together spreadsheets and free dashboards costs more time than a paid tool would, and it is easier to make a formatting mistake that undermines a client's trust in the numbers.
A reasonable rule: build your own for one site with basic needs. Pay for a platform once you are reporting on more than two or three properties, reporting to outside clients, or tracking more than rankings and traffic.
If the person reading the report is not technical, the tool matters less than how the findings are explained. Pairing any report with a plain-language walkthrough of what each section actually means closes that gap regardless of which platform produced it.
FAQs
What should an automated SEO report include?
At minimum, it should cover search engine rankings, organic traffic, search visibility from Google Search Console, technical SEO issues, and backlink changes. Many reports now add AI visibility as a sixth line item.
How often should automated SEO reports run?
Rankings and search visibility benefit from a weekly cadence, since they can shift quickly. Technical audits and backlink reviews are usually fine monthly. Match the frequency to how fast each metric actually moves.
Is automated SEO reporting accurate?
It is as accurate as the data sources it connects to. Google Search Console and Google Analytics are reliable primary sources. Errors usually come from mismatched date ranges or blending tools that calculate the same metric differently without labeling which is which.
Can I automate SEO reporting for free?
Yes, for a single site with basic needs. Google Looker Studio and Google Analytics can be connected into a scheduled, automatically updating report at no cost. You lose white-labeling and multi-source blending at that tier.
Does automated SEO reporting cover AI visibility now?
Increasingly, yes. As more consumers turn to AI tools for recommendations, tracking how often a brand is cited or suggested by those tools is becoming a standard part of a complete report, alongside traditional Google rankings.
See What Automated SEO Reporting Looks Like on Your Site
Automated SEO reporting only proves its worth once you act on what it shows you. Set it up once, connect the sources that actually match your goals, and check the report on a schedule you will actually keep. If you want to see the format before committing to a tool, look at a sample SEO report built the way a finished automated report should read, then talk to the team about setting one up for your own site.
Resources / References
Sources
About the author
SearchBlueprint researched, wrote and scored this article with the content pipeline our customers run on their own sites. The score in the byline is what our content engine gave this page before it published. Nothing here is reviewed by hand, which is the point: it is the product's output, published where anyone can check it.